Dealer greek flows
Gamma, delta, vanna and charm — where dealer exposure sits, and what it forces them to trade.
Dealer hedging is the most mechanical order flow in the market. Market makers hedge because their books require it, not because they have a view — and four greeks decide how much they have to trade, and when. Gamma answers what happens if price moves. Delta is the position they are carrying right now. Vanna is what a change in volatility does to it. Charm is what the clock alone does to it.
Most tools stop at gamma. GammaLab charts all four, on the same option chain, for SPX and a long list of single stocks and ETFs.
Gamma: how hard they hedge when price moves
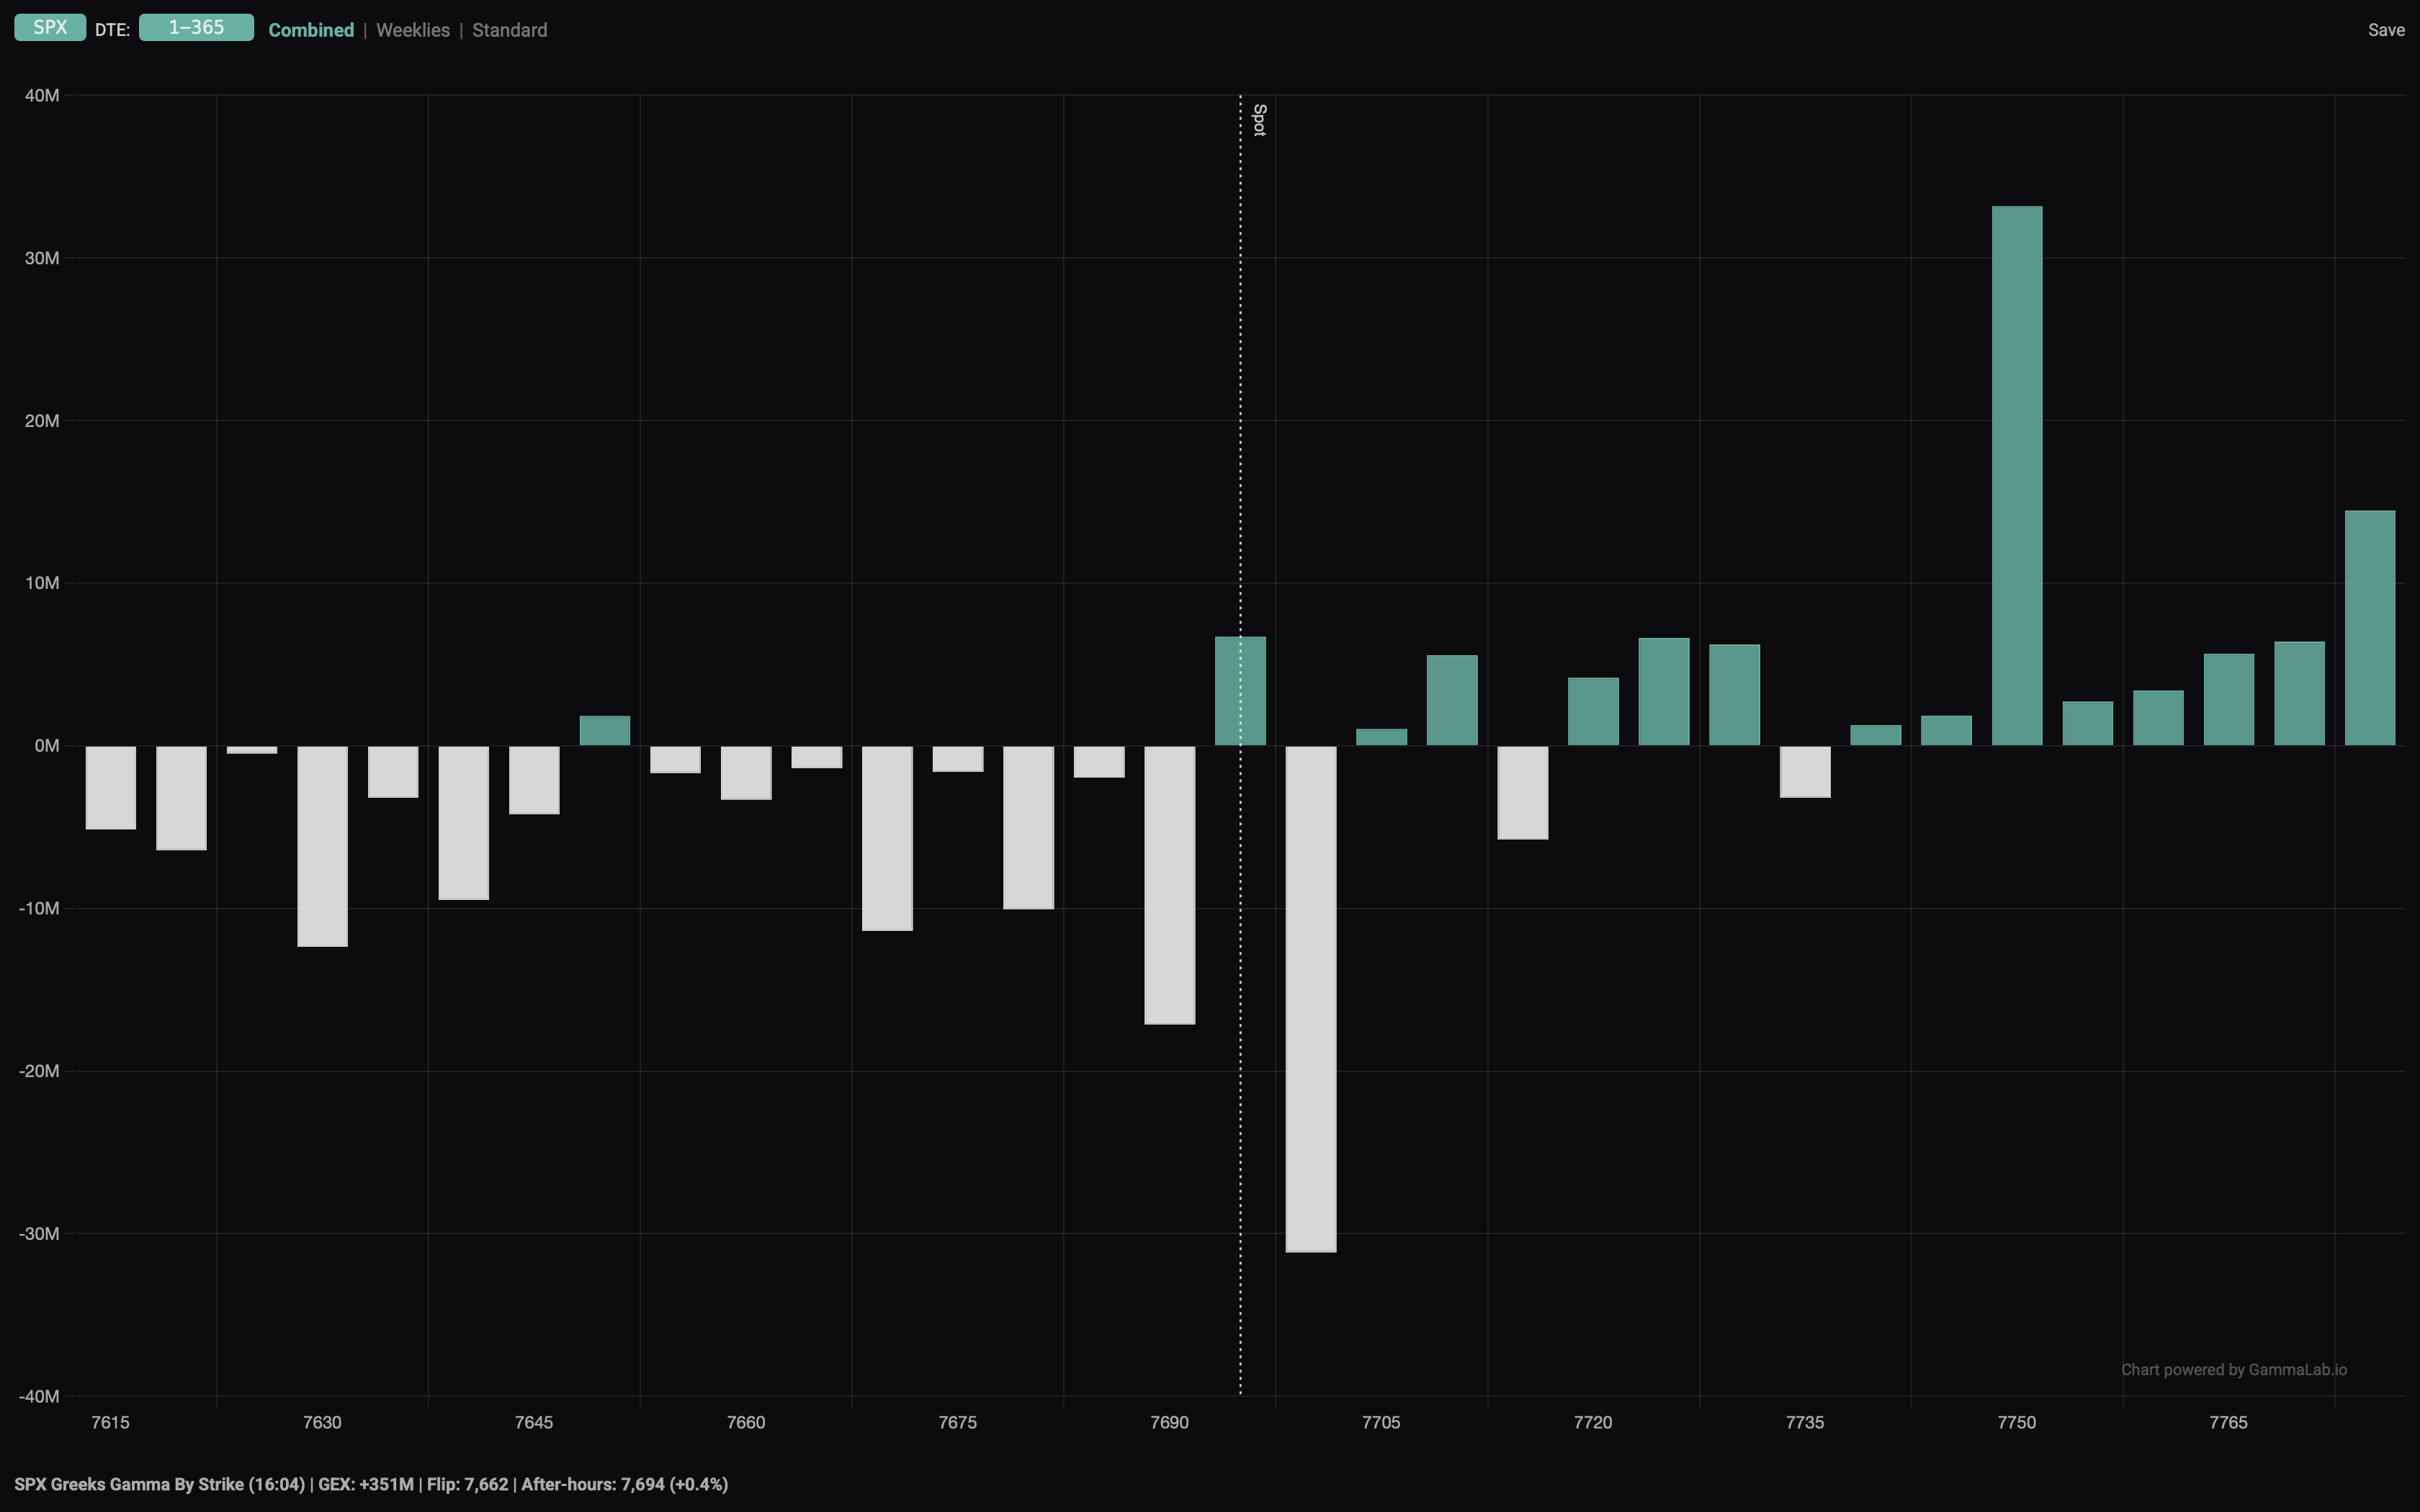
Every option a dealer holds carries gamma: the rate at which its delta changes as the underlying moves. Aggregate that across the whole open interest and you get the market's net dealer gamma exposure — how much hedging flow a one-point move will force, and in which direction.
When dealers are long gamma, they hedge by selling into strength and buying into weakness. That flow is stabilising: volatility gets damped, ranges hold, and pullbacks find bids that have nothing to do with sentiment.
When dealers are short gamma, the same mechanic runs in reverse. They must buy as price rises and sell as it falls, chasing the move in both directions. Ordinary selloffs turn disorderly, and liquidity thins out at exactly the moment you need it.
The level where the aggregate flips between the two is the gamma flip level, one of the most-watched lines on an index chart for good reason: the character of the tape genuinely changes as price crosses it.
You get the full profile across the strike ladder, the same profile re-computed at hypothetical prices so you can see the exposure change as price travels, and a history of the totals and the flip level itself.
Delta: the position they are carrying
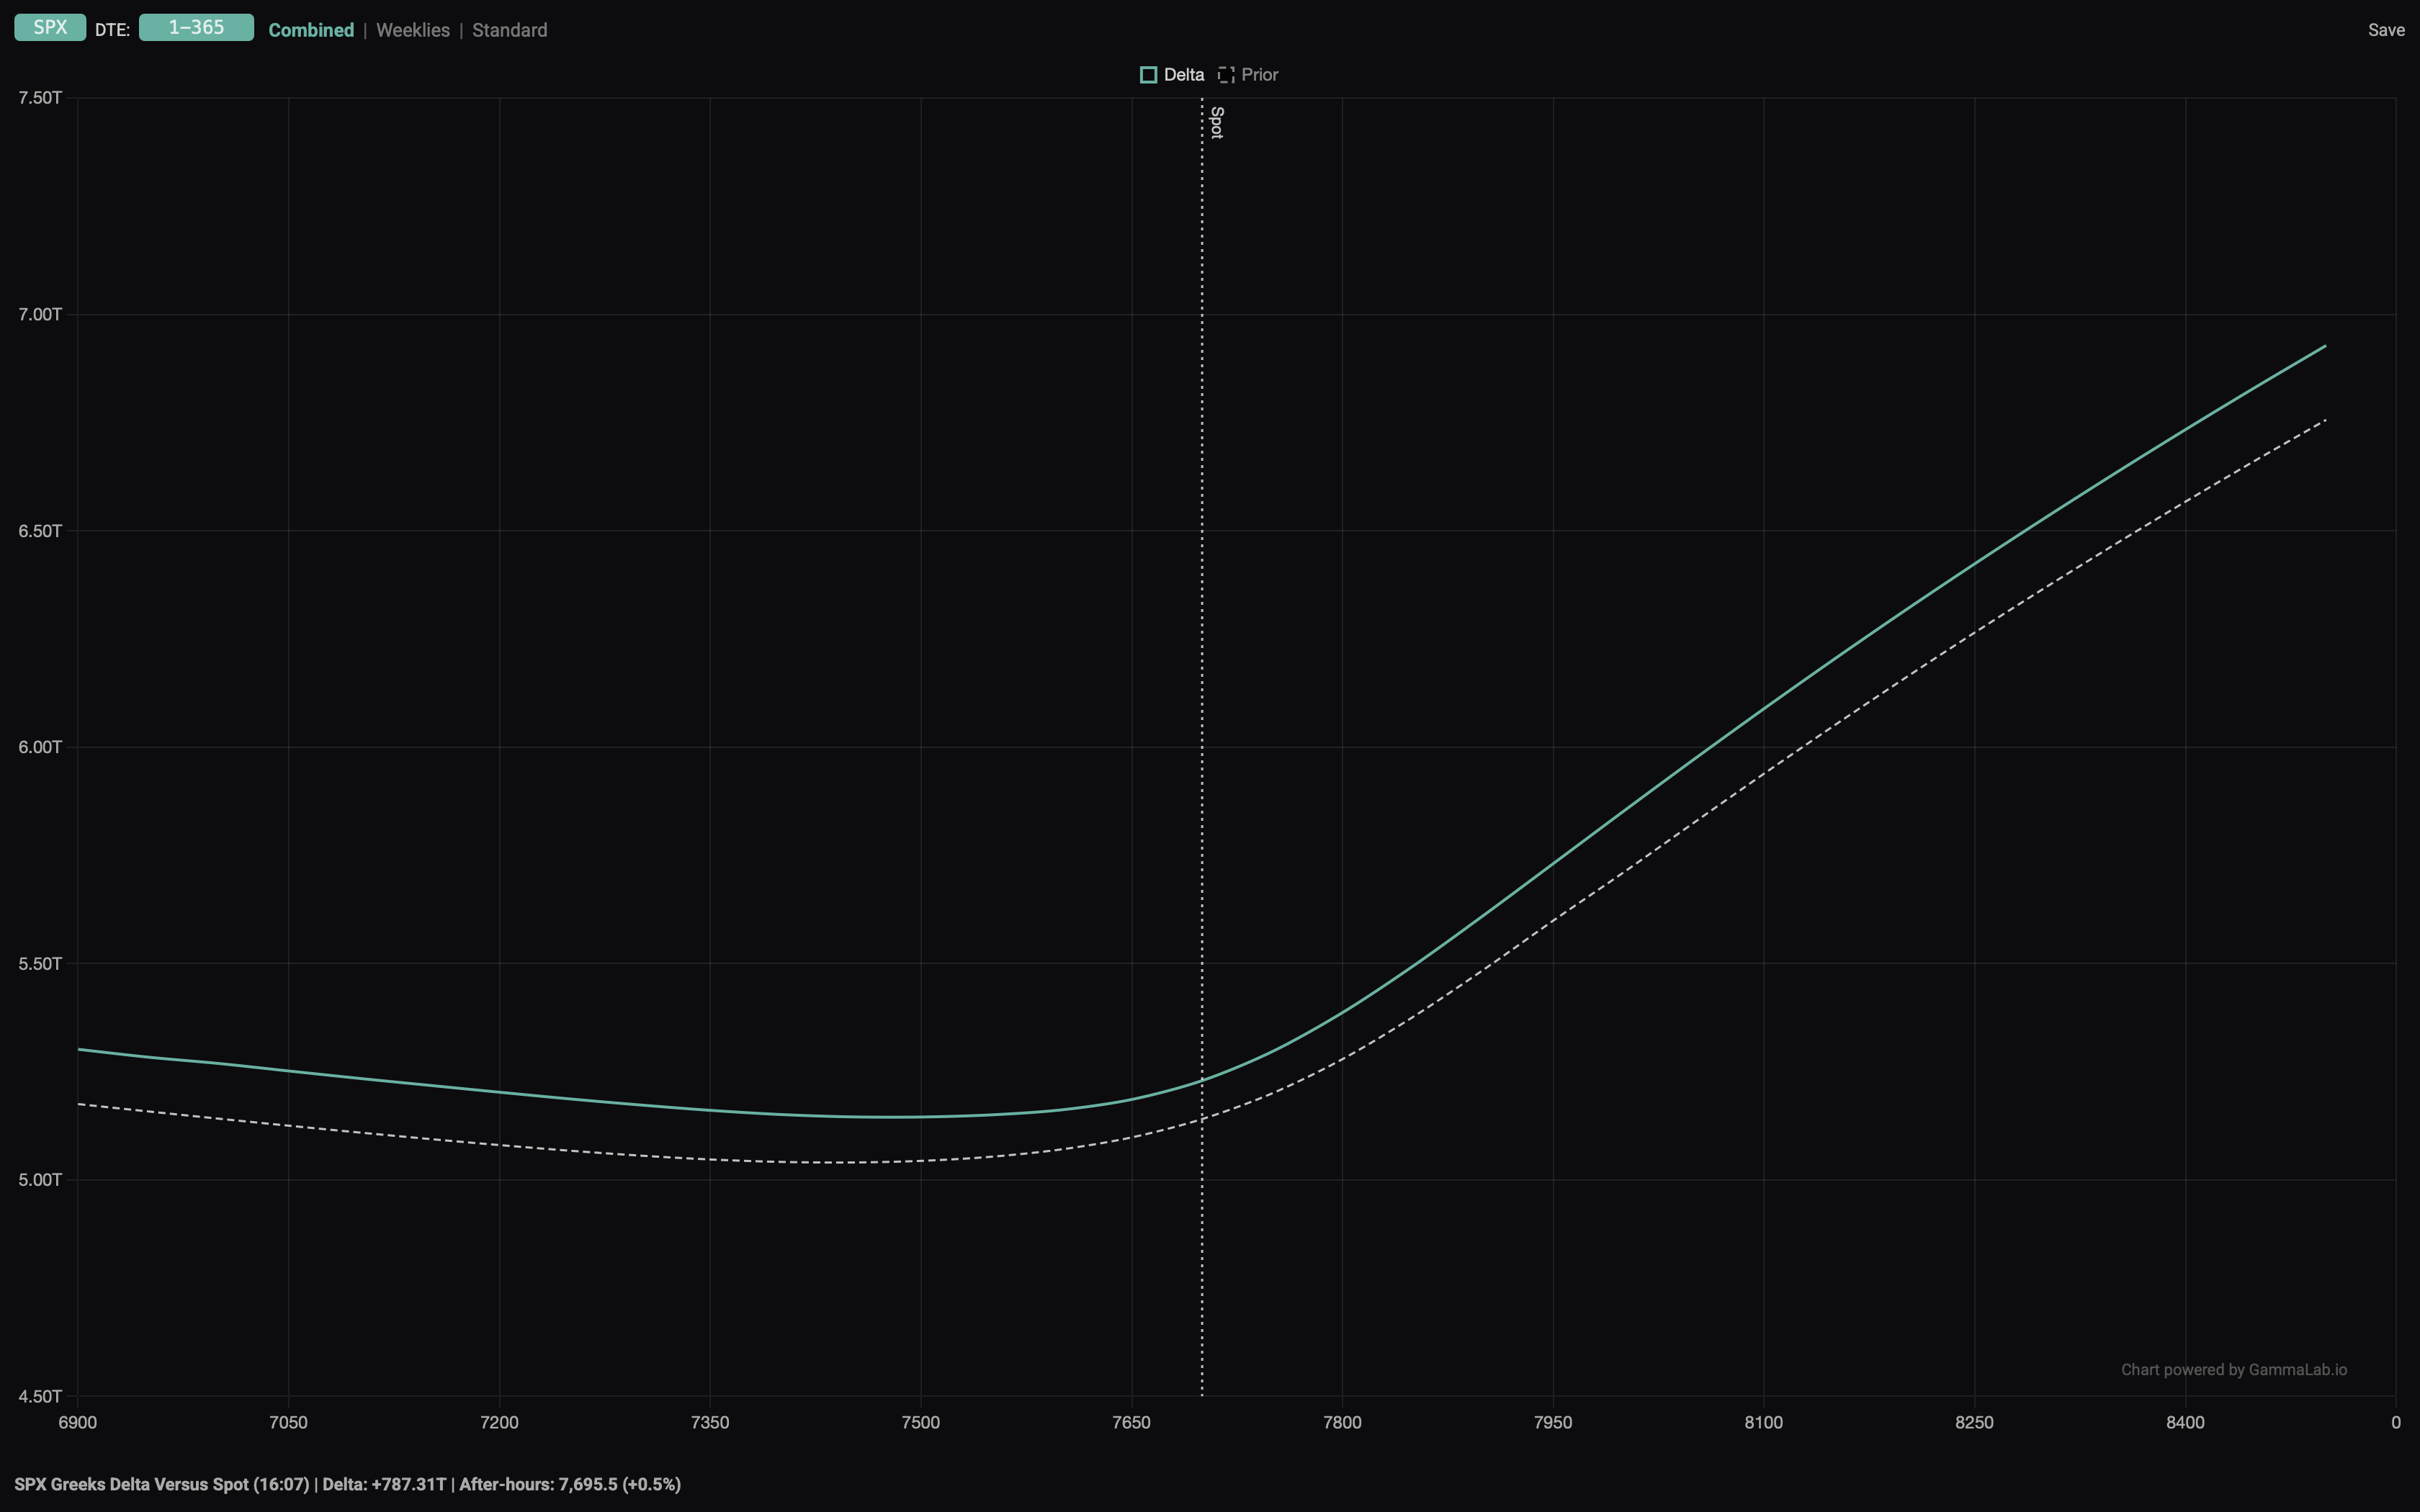
Dealer delta exposure is the directional position the street is holding as a consequence of everything clients have bought and sold. It is the stock, not the flow — and it is what has to be neutralised in the underlying.
You get it across the strike ladder and swept against hypothetical prices, with yesterday's profile drawn beside today's, so the hedging on the way to a level is visible before price gets there.
This is dealer delta as positioning. For dealer delta as traffic — signed option prints classified trade by trade and totalled through the session — see delta-hedging flows, which is a separate set of charts built from trades rather than open interest.
Vanna: what volatility does to the position
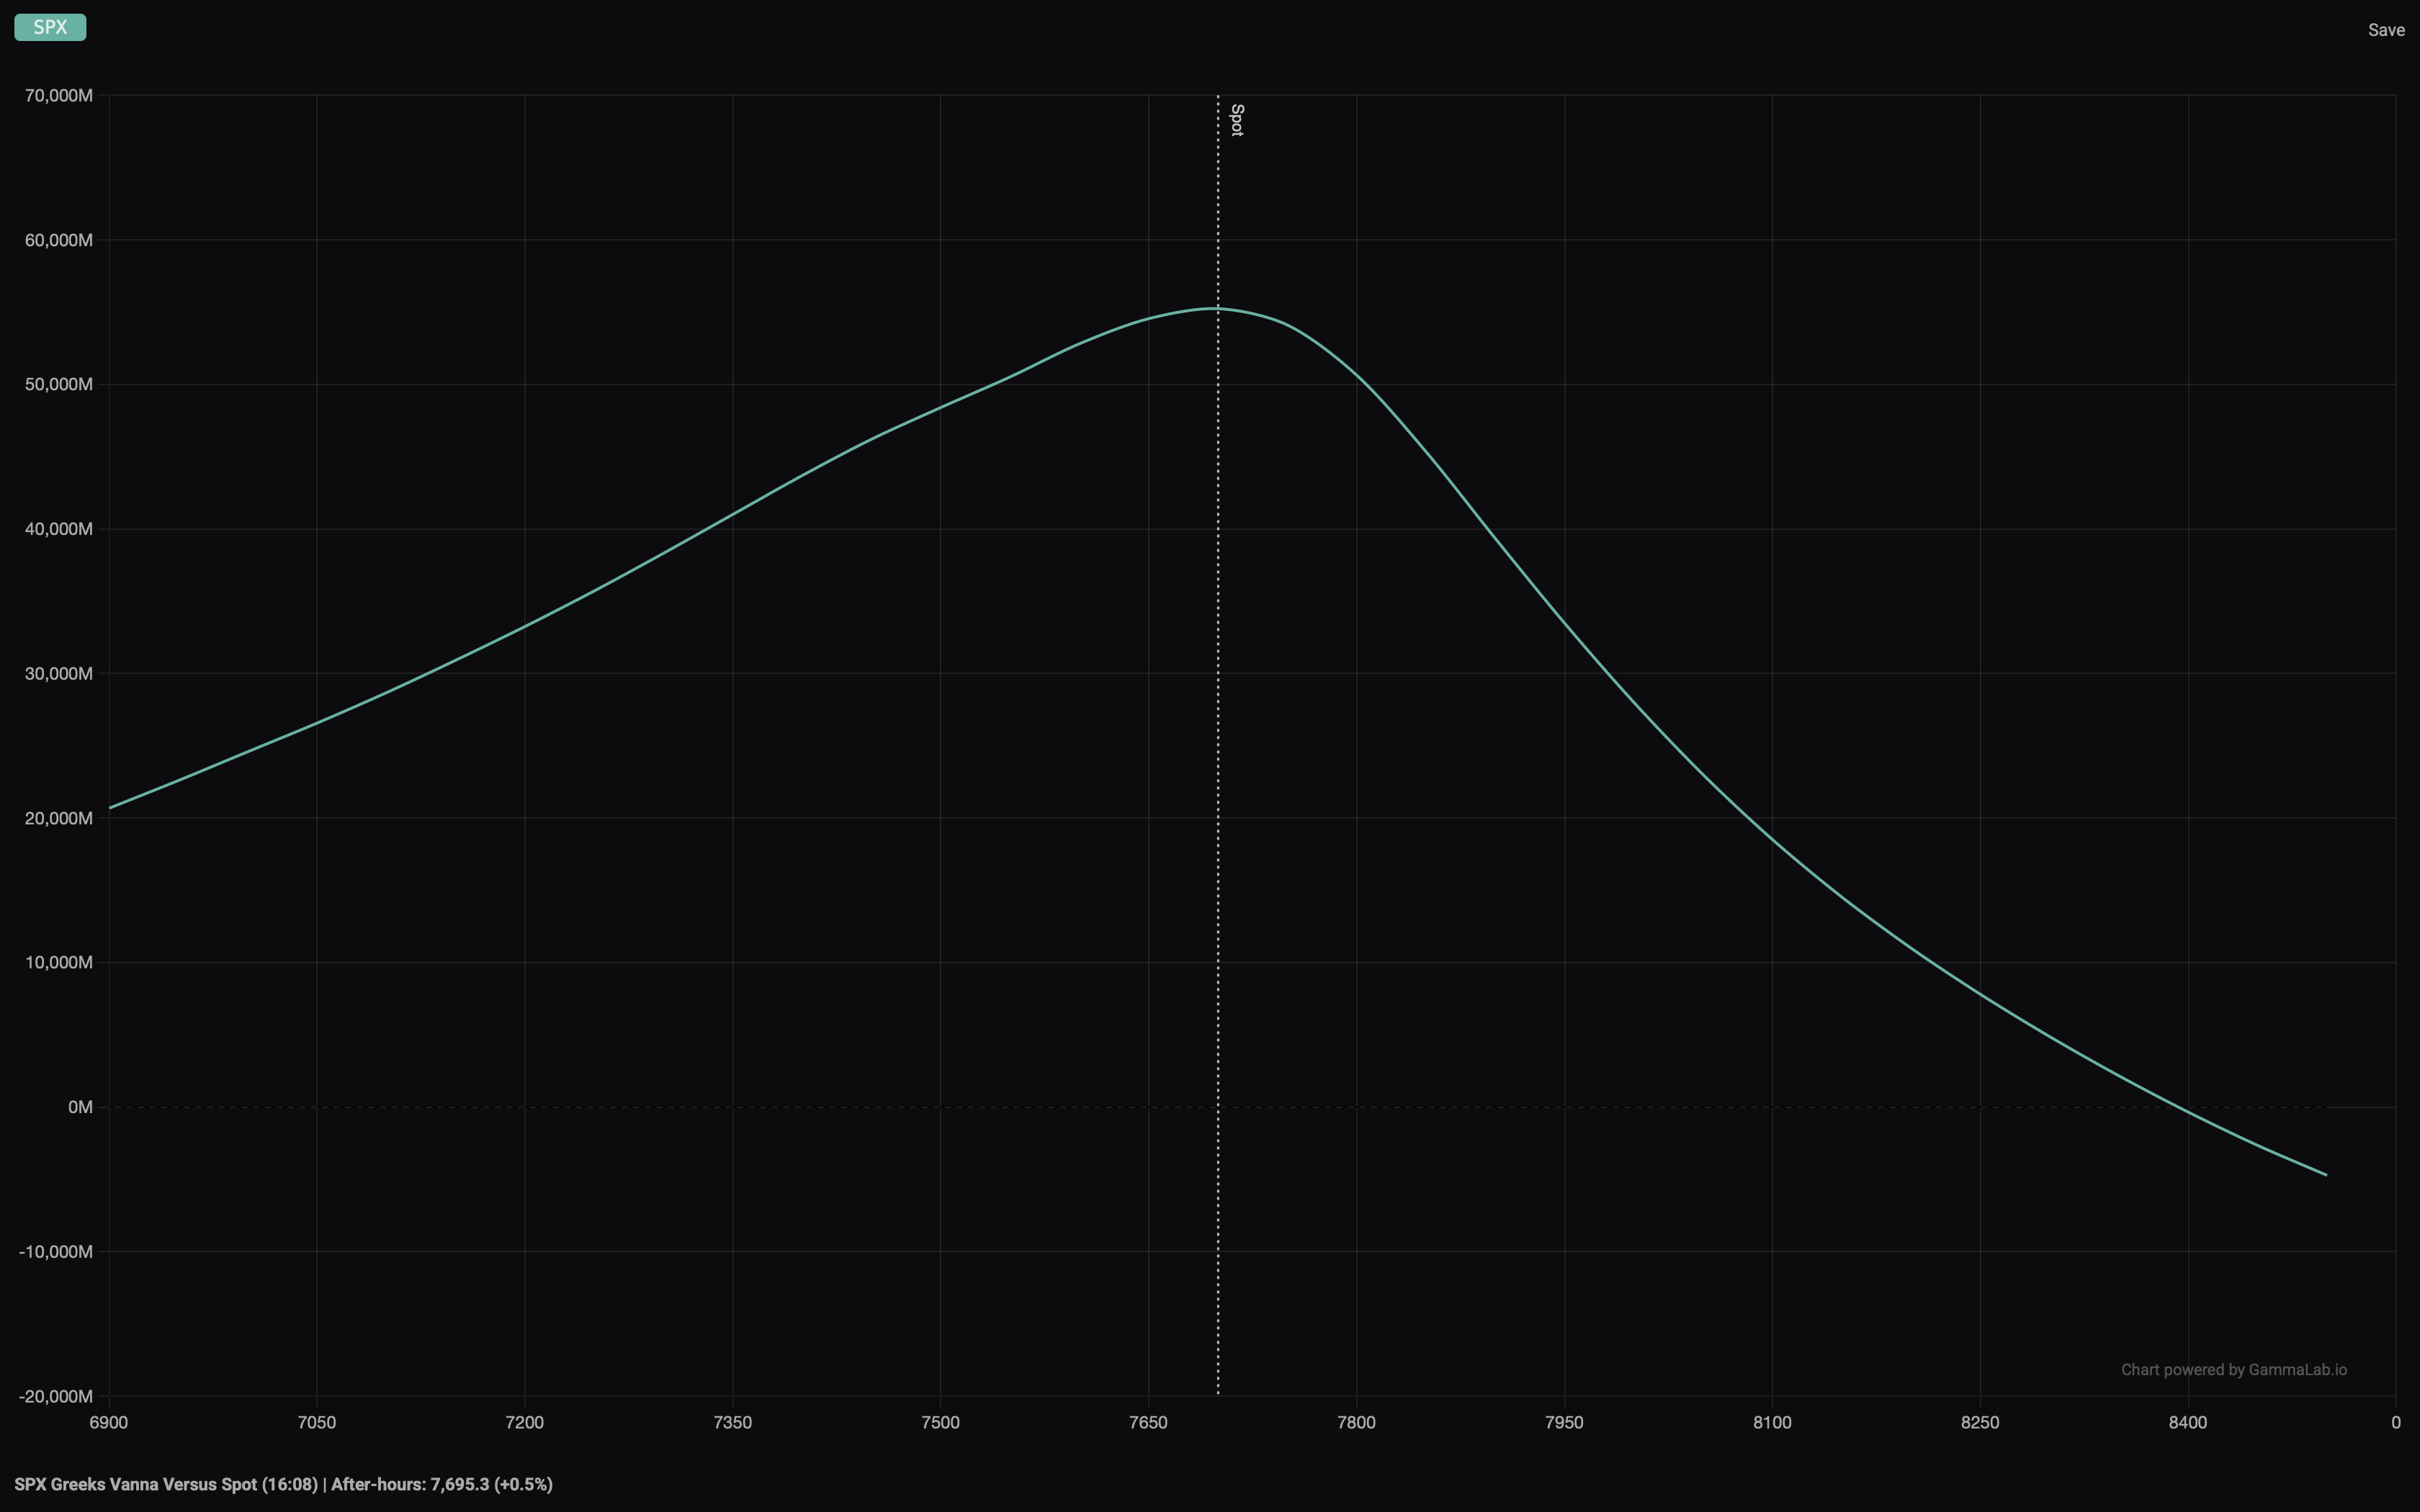
Vanna is the part almost nobody charts, and it explains a great deal of what looks unexplainable. It measures how dealer delta changes when implied volatility changes, with price standing still.
That is the mechanism behind the slow, relentless grind higher that often follows a scare. Volatility falls, the delta on a huge book of puts drains away, dealers are left with too little hedge, and they buy — day after day, with no news to point at. It runs just as hard the other way: a vol spike alone can force selling into a market that has not moved yet.
You get vanna by strike, against price, and against volatility itself — that last one tells you what a two-point drop in the VIX is actually worth in hedging flow.
Charm: what the clock does to the position
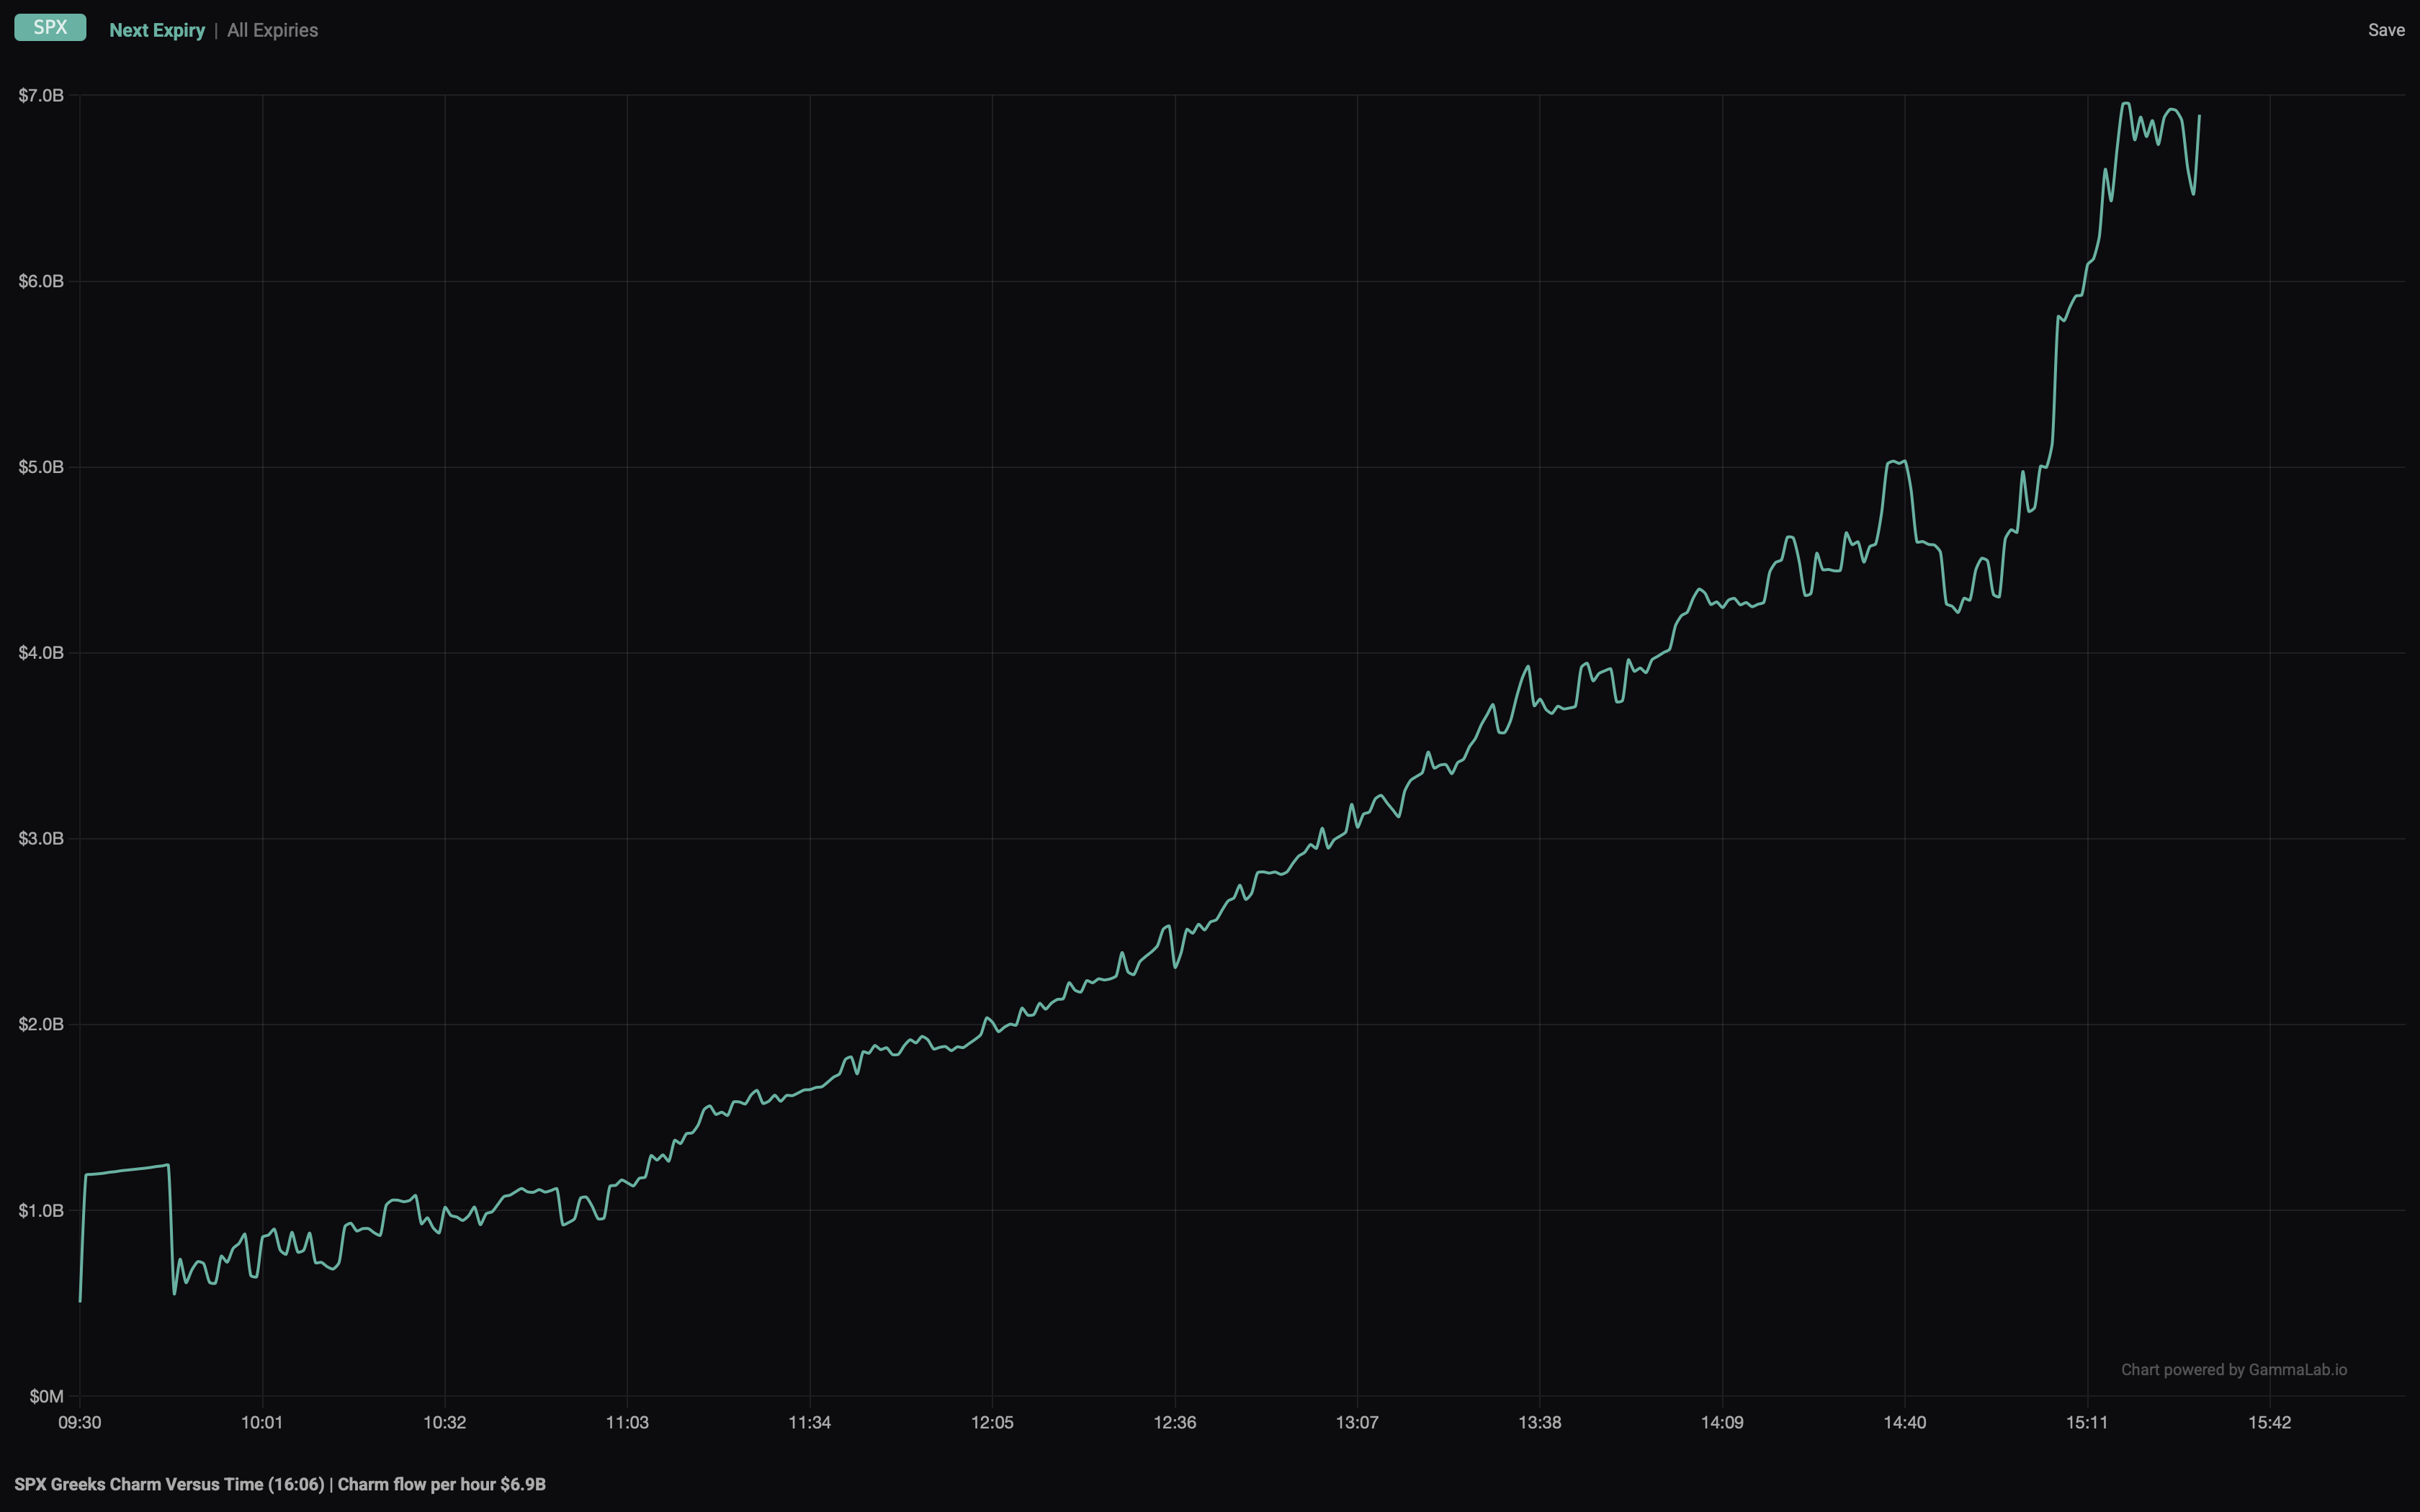
Charm is delta decay: how much delta a dealer loses to the passage of time alone, with price and volatility both unchanged. It is a rate, and GammaLab quotes it in dollars per hour, because that is the form in which it is actually tradeable.
Charm is why so many sessions have a distinct character into the close, and why expiration days do not behave like other days. The hedge that has to come off before the bell has to come off whether or not anyone wants to trade it.
You get the decay rate across the ladder, and the session drawn as one line — measured for what has already happened, projected for the rest of the day — with the amount still left to hedge before the close underneath it.
Live, not a daily snapshot
All four are rebuilt from the full option chain through the trading day and update by the minute while you have them open. Open interest is the real, full chain figure — nothing is estimated up from a sample — and the intraday charm line is recorded minute by minute as the session runs, not reconstructed afterwards.
These are context, not signals, and they are strongest read together. Put together, they answer the question that matters at the open: is today a day where flows hold the market still, or a day where flows push it?